Frequently asked questions
Search, or pick a topic.
40 answers
What is Retascope?
Retascope is a node-based production workspace for game studios. It shows where time and money go on every task and department, and keeps the tickets, check-ins, conversations, meetings and files behind that work together in one connected graph.
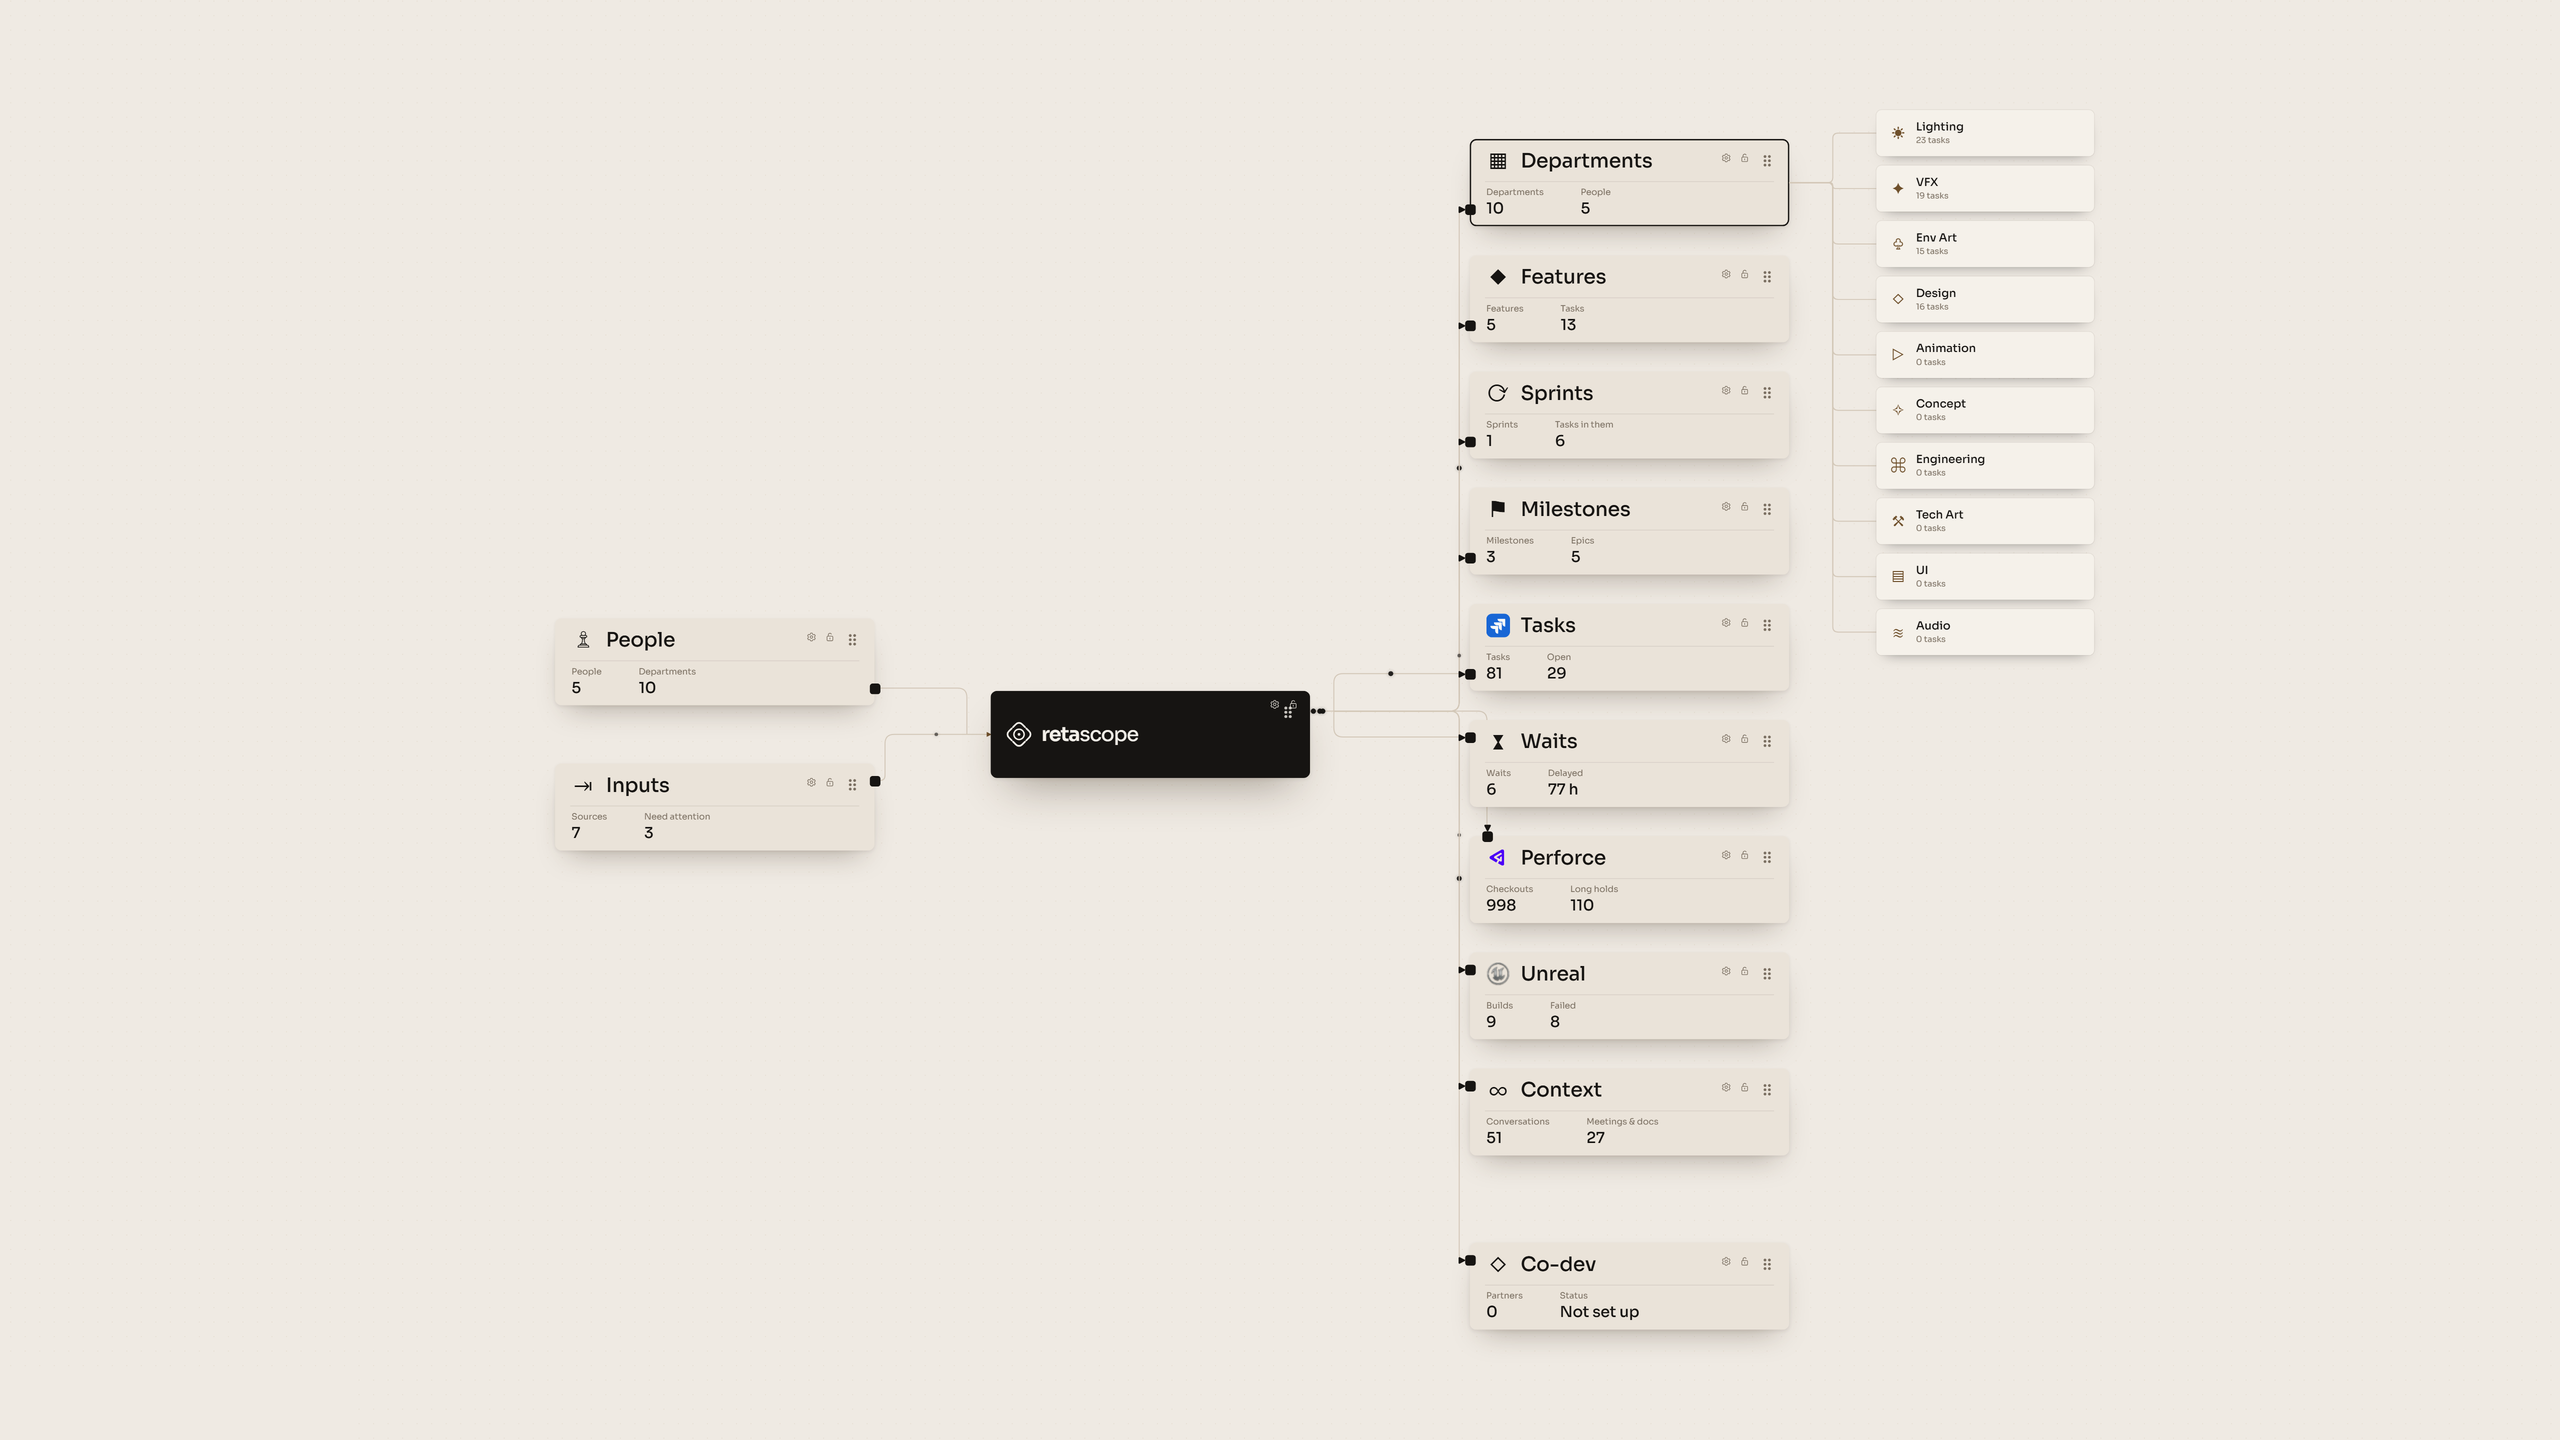
The graph is the app. Open Lighting, for example, to see its tasks, meetings, conversations, people, assets, activity and costs. Open a task to see its timeline, contributors, file changes, decisions and references. You can arrange and lock nodes, switch to Focus mode for one page at a time, or open views in their own windows across monitors.
What it covers:
- Time and cost: editor activity and estimates matched to tasks and priced at your rates, including unlinked work, meeting time and comparable tasks.
- Context: Jira history, Perforce changes, Slack conversations, meeting notes and transcripts, Miro boards and other records, kept next to the work they explain.
- AI briefs: summaries of the studio, a department or a task, covering progress, decisions, gaps and next steps, linked to their sources.
- AI playbooks: describe the review or report you need; Retascope builds the workflow, shows each step and saves it to run again.
- Reviews and sharing: screenshot reviews, full-screen views, and exports to reports, spreadsheets, slides and images.
- Production signals: build results, repeated asset edits, source health, automation activity and editor performance, where those records exist.
The goal is less time searching and reporting, and more time making the game. What you see depends on the tools, plugins and rates your studio sets up. Explore the actual app in the live demo →
Does Retascope replace Jira?
No. Retascope works alongside Jira. It reads your tickets and their status history, adds the time, cost and context around them, and can create Jira tasks with an owner, department, brief and references attached.
What can I see on a ticket?
Its time and cost, who worked on it, an activity timeline, the task story, linked files, review boards, and the conversations and meeting notes about it.
How does context reach the right ticket?
Retascope matches records to tickets by their ticket keys and the files they touch. If AI is set up, it can also suggest matches for meeting passages. You confirm or dismiss the uncertain ones, and Retascope remembers your choice.
Can I create a ticket with references attached?
Yes. Enter the task name, department, owner and an optional description. Search your connected tools by keyword, pick the matches you want, and they are attached to the new Jira task.
How are time and cost calculated?
Time comes from plugins in Unreal Editor, Photoshop, Maya, 3ds Max, MotionBuilder and Substance 3D Painter, which report the map or file being worked on. The Retascope tray tells active work apart from idle time or an app left in the background. Where there is no plugin, Perforce check-ins can fill the gap with an estimate, without counting the same hours twice.
Cost is that time multiplied by your rates. Working hours, lunch, meetings, leave and other tasks limit what can be counted, and a file left open or checked out does not count as editing time.
Can I compare similar work?
Yes. Comparable-work views list similar tickets with their time and cost. Retascope suggests which tickets are similar, and you confirm the ones that count.
How do screenshot reviews work?
An artist picks a task and a Miro board and turns on automatic screenshot uploads. New matching screenshots are added to the board. Uploads are off until turned on, can be paused at any time, and the original screenshots stay on disk.
Where is data stored?
On your studio’s own machine or server, in a local database. Connected tools and AI features only talk to the providers you set up. The public demo uses cleaned-up sample data.
Can I share reports?
Yes. Export views and pages to PDF, Excel, PowerPoint or images, copy the data, or prepare content for Miro and Confluence. The formats on offer depend on the view.
Is the featured ticket connected to the app?
Yes. It is the real app, running on a sample project, so you can explore it without connecting any studio’s accounts. In your own installation, tickets come from your connected tools.
What does Retascope connect to?
Jira, Perforce, Slack, Miro, Confluence, calendar and meeting services, and build results. Editor plugins cover Unreal Engine and Adobe and Autodesk tools, and an SDK covers your own engine. Any other app with an API can be connected too.
Can Retascope connect to a tool that isn’t listed?
Yes. Any app with an API can be integrated. A connector reads the app’s API and adds its records to Retascope, where they sit in the graph next to Jira, Perforce and Slack and link to the same tasks. That includes in-house tools and databases that have an API.
Engines and in-house tools can also send activity straight to Retascope through the plugin SDK, in its JSON event format.
Do we need Unreal Engine?
No. Plugins for Adobe and Autodesk tools, and the plugin SDK for your own engine, record editor activity without Unreal. Perforce check-ins also give time estimates for files made without a plugin.
How do we connect our own engine?
With the plugin SDK. Your engine sends editor activity and operation events to Retascope. A Python SDK is included, and any other language can send the same JSON events.
What are playbooks?
A playbook is a saved, reusable workflow. Describe what you need, and it gathers the right records, keeps their sources and date range, and produces the report, slides or data you asked for.
Does it change anything in our tools?
No, not unless you turn on an action. Collecting data only reads your tools. Actions you turn on can create or update Jira tasks, post Slack digests or answers, and add Miro items or screenshot uploads, using only the permissions you give them.
How is work time measured?
Active time recorded by an editor plugin comes first. App focus, idle time and the files that are open match that time to tasks. Where there is no plugin, Perforce activity gives a separate estimate. Working hours, lunch, meetings, leave and other tasks limit what can be counted.
Do checkouts count as work time?
No. How long a file is checked out, or how long a ticket sits in a Jira status, is not working time. Retascope shows those separately.
Can an AI suggestion change a cost?
No. Costs only use confirmed task links, recorded activity and your rates. An AI suggestion adds no time or cost until someone accepts it.
Where do the rates come from?
From your settings: rate bands, individual payroll if you turn it on, and contracted partner rates. Retascope multiplies counted work time by those rates.
Where does the AI run?
On the model service you choose: a local model through Ollama, or a dedicated AI server for your studio. The public demo shows saved examples and does not connect to any AI service.
How are salaries handled?
Salaries are optional. If you turn on individual payroll, authorized operators can import salaries and job titles. They are stored encrypted, and your role settings decide who can import them and who can see personal pay.
Can artists see costs?
No. The artist view shows tasks, references and work time, with no costs. Producer and executive views follow the access roles your studio sets.
How is it installed?
With Docker Compose, or a local install on a studio machine or server. Then connect your tools and set your working hours and rates. Built-in diagnostics check each connection.
What does the editor performance report need?
An editor plugin on the artists’ machines: Unreal Engine, a supported Adobe or Autodesk tool, or your own engine through the SDK. It records how long editor operations take and when they fail. Crash dumps and call stacks are not uploaded.
What does “node-based” mean?
Everything in Retascope sits on a graph as a node, with lines showing how nodes relate. Some nodes are places you can open, like a tool, a department, a task or a page. Many are pieces of information: a ticket, a check-in, a meeting note, an AI brief, or a single data point such as hours, a cost or a status.
Groups gather related nodes, so a task sits with the records and numbers behind it. Click a node to open it, for example Retascope → Departments → Lighting → Tasks, then a task and its records.
Can I use Retascope without navigating the graph?
Yes. Focus mode shows one page at a time with a searchable Pages list. Switch back to the graph whenever you want to see the connections. Both show the same workspace.
Can I arrange nodes and customize the workspace?
Yes. Pan, zoom and fit the graph, move nodes and groups, lock positions, and save or load layouts. Square and rectangular node shapes each keep their own arrangement.
Pick a theme (Dark, Light, Slate, Tan, Violet or Satin), change the font and grid pattern, or use the Theme editor to set your own colors.
Can I work across multiple monitors?
Yes. Open any page in its own window, so the graph stays on one screen while a task, cost view or conversation sits on another. In a single window you can also add a second page pane, resize the panes, and zoom in or go full screen.
What do the AI briefs explain?
A brief summarizes the studio, a department or a task: progress, recent work, decisions, problems and suggested next steps. Open the full brief for more detail and the records behind it.
A brief only knows what had been collected when it was written, so check its date and sources.
How does an AI playbook work?
Describe the result you want, for example a review of a task with its conversations, meetings, costs and screenshots. AI turns that into a workflow of nodes: the sources, the steps and the output.
Check the plan, watch the log as it gathers records, and review the result. Save it to run again later with new inputs or dates.
Can I check where an AI result came from?
Yes. Briefs and playbook results link to the records they used, and task views show the timeline, conversations, meeting notes, assets and references behind them. Uncertain matches and missing sources are marked as such, never shown as facts.
How do conversations and meetings connect to production?
Slack threads, meeting notes and transcripts are linked to the departments and tasks they are about. That lets you follow a decision or review request to the files and work that came after it. AI briefs and playbooks use the same linked context.
What can I see at studio and department level?
Delivery, contributors, work time, costs, meeting load and recent activity. Each figure opens onto the tasks and records behind it. Production pulse, cost signals and studio metrics show the same work from other angles.
Costs show what has been spent, not the budget that is left.
Can Retascope help identify rework and production delays?
Yes. Repeated asset edits, task history, build results and editor performance point to work worth a closer look, and comparable tasks and linked conversations add context.
Retascope shows you the evidence and you decide the cause. A revised asset is not automatically wasted work, and a failed build alone does not prove a schedule slip.
Which formats and destinations can I export to?
PDF reports, Excel spreadsheets, PowerPoint slides and images, plus copy, print, and content for Miro and Confluence, depending on the view. Some views can also collect items into one PowerPoint deck.
Open a chart, card or page full screen to find its export options.
How do I know whether the information is complete?
Source health shows which connections are working, stale, failing or not set up, and the cost and automation views show what is linked and where the gaps are.
Missing data does not mean no work happened. Without a plugin, for example, editor delays and crashes are unknown, and work with no task link is listed apart from task costs.
Can playbooks run on a schedule?
Yes. Open a saved playbook, expand Schedule and choose daily, weekly or once, with a time zone. It reruns on fresh records and shows the next run. You can pause it at any time.
Your Retascope server has to stay on, but the browser can be closed. Runs wait their turn if another playbook is running, missed runs combine into one after a restart, and archiving a playbook pauses it. Downloads and exports still need you to press export.
In the live demo, schedules replay sample data while the page is open and are saved in your browser.
How do editor and art-tool plugins improve time tracking?
They record what is actually being worked on. The Unreal Editor plugin reports the map and assets; the Photoshop, Maya, 3ds Max, MotionBuilder and Substance 3D Painter plugins report the saved file. The Retascope tray adds whether the app is in focus and how long since the last input, so idle and background time is left out.
Confirmed task links, assignments and check-ins connect files to tasks, and anything without a task is shown as unlinked work. Plugin hours replace Perforce estimates for the same work, so nothing is counted twice, and your rates turn hours into cost.
The plugins must be installed and the tray running. Photoshop tracking is Windows-only for now, and unsaved files or interruptions can leave gaps. Plugins never record what you type or what is in your files.
No matching questions. Try “time”, “Jira” or “data”.
Still have a question? Contact us